|
Flett Research Ltd
440 DeSalaberry Avenue, Winnipeg MB CANADA Phone/Fax: (204) 667-2505 |
|
|
|
|
|
|
|
|
|
| >>FLETT HOME PAGE >> RADIOISOTOPES >> UNDERSTANDING Pb210 |
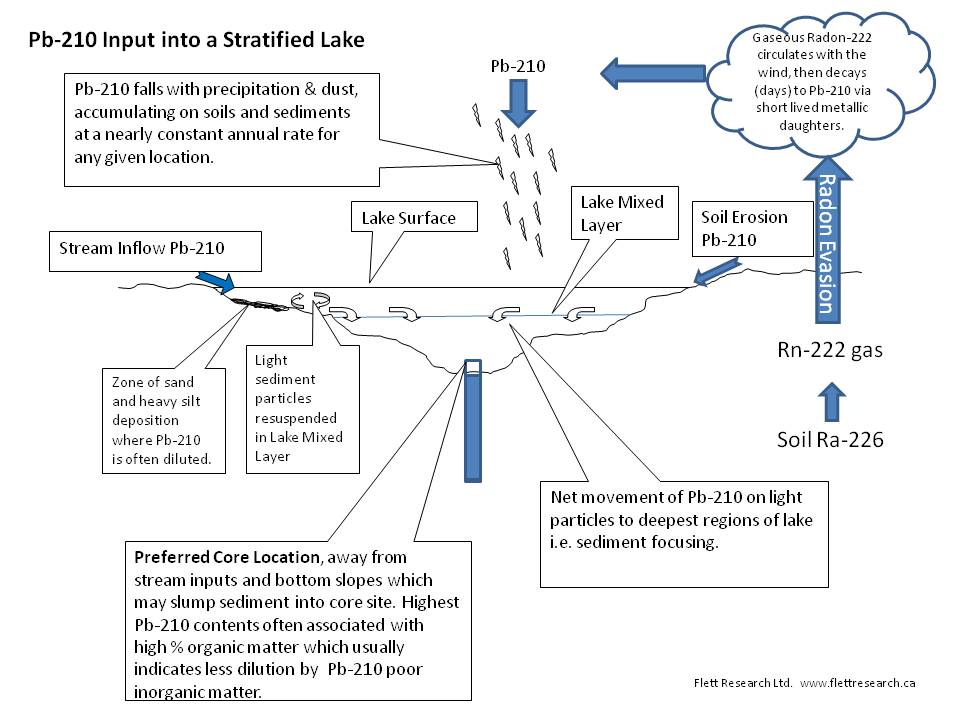
Flett Research - Understanding Lead-210 (Pb-210) The Pb-210 method is used to determine the accumulation rate of sediments in lakes, oceans and other water bodies. In a typical application, the accumulation rate over a period of 100 - 200 years is obtained. From the accumulation rate, the age of sediment from a particular depth in the sediment column can be estimated. Pb-210 is a naturally occurring radioactive element that is part of the uranium -238 radioactive decay series. The radioactive element uranium has an almost infinite half-life (4.5 x 10⁹ yr) and for these purposes can be considered to be present at an unchanging concentration (over time) in the earth's crust. Although the concentration of uranium varies from location to location, it is present in essentially all soils and sediments, at least at some low level. Over time the uranium-238 very slowly decays into uranium-234 (half-life = 248,000 yr) which decays into thorium-230 (half-life = 80,000 yr) which decays into radium-226 (half-life = 1620 yr). Radium-226 in the soil exhibits the same level of radioactivity as uranium-238 from which it was originally derived, because of a natural phenomenon called secular equilibrium. The overall result is that radium-226 is found at low and essentially unchanging levels in soils everywhere. CLICK ON IMAGE TO OPEN IN FULL SIZE
When radioactive radium-226 decays, it produces the radioactive inert gas radon-222 (half-life = ~ 3.8 days). Radon (Rn) gas can escape to the atmosphere before it decays into the next radioactive element ( a nonvolatile metal), if it is produced in soils close to the air-soil interface. This radon emanation is a normal occurrence and thereby causes the terrestrial atmosphere to contain a low (~ 1 DPM/L = 1 disintegration per minute per litre) but fairly constant level of radioactive gas. After several days residence time in the atmosphere, the Rn-222 naturally decays to polonium-218, a metallic radionuclide which, over a period of hours/days, falls to the earth with dust and rain. A number of subsequent radioactive decays occur over a period of minutes and Pb-210 (half-life = 22.3 yr) is produced. The Pb-210 which falls into a lake or ocean tends to end up in the sediments over the next few months and becomes permanently fixed on the sediment particles. Within 2 years, polonium-210 (Po-210), the granddaughter of Pb-210, is in secular equilibrium (i.e. the same activity) with the Pb-210. It is actually the alpha emitting Po-210 that we measure because it provides more accurate estimates of the Pb-210 than will direct measurements of Pb-210. When applying the Pb-210 technique, we assume that lake and ocean sediments are receiving a constant input of Pb-210 from the atmosphere. Pb-210 that was incorporated into the sediments 22.3 years ago will be only one half as radioactive as when initially deposited. This property of radioactive decay can be used to calculate the age of sediments at other depths in the sediment column and/or the rate of sediment accumulation. Analysis of Pb-210 Data The Linear Regression Model In a 'perfect' core, if log [excess Po-210 activity] is plotted as a function of accumulated dry weight of sediment, the line through the data should be a straight line. Excess Po-210 is the amount of the Po-210 isotope that is in excess to the background Po-210 produced in the sediments by Ra-226. The excess Po-210 is assumed to be from direct atmospheric deposition of Pb-210 plus the import of Pb-210 from the watershed. It is also assumed that the rates of isotope input and sediment input are constant over time. In the real world, cores are often not 'perfect' and they exhibit deviations from the ideal data set: 1. The data may reveal a vertical Po-210 activity profile in the core surface. This is often seen and is usually interpreted to mean mechanical mixing of the surface sediments by benthic organisms or by hydrodynamic activity of the overlying water. 2. The Po-210 activity may peak slightly below the sediment surface. This is commonly seen and may be caused by steep redox gradients across the uppermost few centimeters of sediment. 3. The deepest sections analyzed may still appear to be above background levels of Po-210, as evidenced by a non vertical profile in the deepest part of the core. In the case of (1) and/or (2), the data may still form a straight line on a log [excess Po-210 activity] vs. cumulative dry sediment plot if the upper part of the core data is disregarded. This will allow the determination of accumulation rate for the mid portion of the core. If one assumes that the accumulation rate has remained constant in the upper, more recent sediments, then the age of the sediments can be calculated for any depth in the core. In case (3), where the deepest core sections appear to be above background level, the excess Po-210 activity cannot be calculated because there is no estimate of the background level of Po-210. It is possible to indirectly estimate the background Po-210 by measuring the Ra-226 (via Rn-222) in the sediments but this is often omitted because of the additional analytical costs. In lieu of these analyses, it is necessary to make an assumption that the background level is less than the lowest activity measured in the core but greater than zero. An iterative best fit computer model was designed to process the data in cases where the Po-210 background activity is not known. It is based on the assumption that a 'perfect' core will exhibit a linear decrease in log [excess Po-210 activity] vs. cumulative dry weight of sediment. When the data for excess Po-210 are linearly regressed, the regression should produce R2 = 1.00. Since the excess Po-210 activities depend directly on the value of the background Po-210 activity, it is evident that only one level of background will yield a perfectly linear fit of the data. The computer model performs a number of linear regressions, each time using a slightly different value of background Po-210. The 'correct' value of background Po-210 is that which provides the best fit i.e. R2 closest to 1.00. One can then calculate the sediment accumulation rate using the best fit line through the data. In reality, no core is perfect and one never finds R2 = 1.00. It is not uncommon, however, to obtain fits where R2 > 0.95. Occasionally the fits are better than R2 = 0.99. Often the fits are very good over a large range of background Po-210 values tested, and in these cases, only lower and upper boundaries for the sediment accumulation rate can be expressed. While it may not be very satisfying to learn that the sediment accumulation rate in your core is between 200 - 600 mg dry weight/cm2/yr, this is still valuable information when one compares it to a core with a rate of 20 - 60 mg/cm2/yr. Cores which are rich in organics tend to have higher Po-210 activities in their surface sediments, and as a consequence, generally yield better data because the excess Po-210 is much higher than the background Po-210. For example, Canadian Shield lakes can have surface Po-210 activities of 200 DPM/g dry weight and background of 3 DPM/g. Thus, in a Shield core, a 50% error in background determination makes very little difference when calculating a sediment accumulation rate. The situation is quite different, however, in a core taken from a river delta where the rate of inorganic sediment deposition is high. The Po-210 is much diluted in this location and the surface activity may be less than 10 DPM/g dry weight, while at the same time background may be 3 DPM/g. Obviously a 50% error in the background determination will have a significant effect upon the sediment accumulation rate calculation. Furthermore, the accuracy of radioactivity measurements becomes poorer as the activity drops and therefore, even the surface sediments from such regions have significant counting errors (error = [counts]1/2). It is important to note that, in all of the foregoing discussions, the rate of sediment accumulation and Pb-210 deposition have been assumed to be constant. Certainly in some cores this is not true because two or more distinct slopes can be seen in the Po-210 activity profiles. In other cores it appears as though a sudden deposition of low activity sediment has occurred on top of higher activity sediments, perhaps as a consequence of dredging or sediment transport. Less dramatic changes in sediment accumulation rates (or Pb-210 deposition) may not be detected and could yield accumulation rates which are somewhat in error. In spite of these potential difficulties, researchers who use the Pb-210 technique tend to continue with it because the results often make sense when corroborated with other information. The Constant Rate of Supply CRS Model In a core that is long enough to have reached background Po-210 activities, and that has experienced a constant input of Pb-210, it is possible to calculate the age at the bottom of any core section. This calculation, first described in 1978 by Appleby and Oldfield, is based on the fact that cumulative excess Po-210 below any given depth in a core (DPM/cm2) can be compared to the total excess Po-210 in the core and the age calculated for that particular depth. A series of these age calculations can be used to develop a graph of age vs. depth for the core. This model does not require that the rate of sediment accumulation be constant over time. In cores that are too short to include background , it generally should not be used. Depending on the core, calculated ages greater than 60-100 years should be treated with caution because counting errors and small variations in the background Po-210 can cause large changes in the age estimates. For additional information, contact Dr. Robert Flett at flett@flettresearch.ca Return to the Flett Research Radioisotope Page. |
Flett Research Ltd - 440 DeSalaberry Ave - Winnipeg Manitoba CANADA R2L 0Y7 |
Phone/Fax: (204) 667-2505 |